CMR Calculators
Cardiovascular Magnetic Resonance (CMR) provides precise, reproducible quantitative measures that guide diagnosis, risk stratification, and treatment planning across a wide range of cardiac conditions. This page brings together a suite of clinically relevant, easy-to-use CMR calculators designed to support fast, accurate interpretation of key haemodynamic and structural parameters.
Each calculator is built around validated CMR parameters and published methods, presented in an intuitive interface to streamline clinical workflow. These tools are intended to complement expert interpretation, not replace it, helping clinicians derive maximum diagnostic value from CMR datasets.
Body Surface Area Calculator
LA Volume Calculator
NORMAL VALUES
LA area – 2 chamber
MALE: MEAN±SD: 21±5cm2, Lower limit – Upper limit: 12-30
FEMALE: MEAN±SD: 19±5cm2, Lower limit – Upper limit: 10-28
LA area – 4 chamber
MALE: MEAN±SD: 23±5cm2, Lower limit – Upper limit: 13-32
FEMALE: MEAN±SD: 21±4cm2, Lower limit – Upper limit: 13-29
LA volume
MALE: MEAN±SD: 72±20ml, Lower limit – Upper limit: 31-112
FEMALE: MEAN±SD: 64±18ml, Lower limit – Upper limit: 28-100
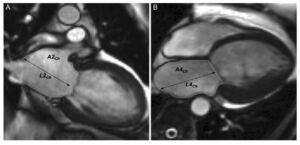
The Biplane Area-Length method, also known as the B-Planer method, is a technique used to measure left atrial volume using cardiovascular magnetic resonance (CMR) imaging. This method involves acquiring images in the horizontal and vertical long-axis cines to measure left atrial end-systolic areas and longitudinal dimensions.[1]
- The above areas are segmented at the end of ventricular systole – when the left atrium is the biggest and just before the opening of the mitral valve.
- The atrial endocardial border should be traced to determine LA area with the exclusion of the pulmonary veins and mitral valve recess. The normal values can vary depending on the inclusion or exclusion of atrial appendage.
- The normal values mentioned exclude LA appendage in segmentation.
The Biplane Area-Length method is based on the assumption that the left atrium is shaped like an ellipsoid. The left atrial volume is then calculated using the formula: 8/3π * (Area1 * Area2 / Length), where Area1 and Area2 are the maximum areas of the left atrium in the four-chamber and two-chamber views, respectively, and Length is the shortest left atrial dimension measured in either view.[1]
This method has been shown to be effective for evaluating left atrial volumes and ejection fraction in both normal subjects and patients with atrial fibrillation.[1] It has also been found to be highly reproducible and accurate, with good interobserver agreement.[1]
References
- SCMR Position Paper (2020) on Clinical Indications for Cardiovascular Magnetic Resonance. Leiner T, Bogaert J, Friedrich MG, et al. Journal of Cardiovascular Magnetic Resonance : Official Journal of the Society for Cardiovascular Magnetic Resonance. 2020;22(1):76. doi:10.1186/s12968-020-00682-4.
ECV Calculator
CMR Derived PCWP Calculator
Cardiac Magnetic Resonance (CMR) derived Left Ventricular Filling Pressure (LVFP) is a significant tool in the assessment and prognosis of heart failure (HF). Studies have shown that elevated CMR-derived LVFP is strongly associated with symptoms and signs of HF, such as pleural effusions, orthopnoea, lower limb oedema, and breathlessness.(1) Furthermore, raised CMR-derived LVFP is independently associated with subsequent HF hospitalization and major adverse cardiovascular events (MACE).[1]
CMR can estimate LVFP in patients with suspected HF, and this CMR-modelled LVFP has been shown to have prognostic power(2). It was found to be superior to transthoracic echocardiography in classifying patients as having normal or raised filling pressures and was associated with an increased risk of death.
In addition to its role in HF, CMR-derived LVFP can also be used to measure acute and dynamic changes in preloading conditions on the left ventricle during adenosine-administered first-pass perfusion CMR, which has been observed to rise significantly (3). In conclusion, CMR-derived LVFP is a valuable tool in the diagnosis, management, and prognosis of HF and other cardiovascular conditions. It provides critical insights into the patient’s condition and can guide therapeutic decisions.
There was a bias issue with the previously published equation to estimate PCWP by CMR which impacted its accuracy especially in females due to lower left ventricular mass than males. This has been addressed in a follow-up paper (4). The new equation which factors in the sex of the patient has been tested in the UK Biobank where raised CMR-modelled PCWP was an independent risk factor for incident heart failure and MACE in the general population (5).
References
- Grafton-Clarke C, Garg P, Swift AJ, Alabed S, Thomson R, Aung N, et al. Cardiac magnetic resonance left ventricular filling pressure is linked to symptoms, signs and prognosis in heart failure. ESC Heart Fail. 2023 Oct;10(5):3067–76.
- Garg P, Gosling R, Swoboda P, Jones R, Rothman A, Wild JM, et al. Cardiac magnetic resonance identifies raised left ventricular filling pressure: prognostic implications. Eur Heart J. 2022 May 4;ehac207.
- Garg P, Javed W, Assadi H, Alabed S, Grafton-Clarke C, Swift AJ, et al. An acute increase in Left Atrial volume and left ventricular filling pressure during Adenosine administered myocardial hyperaemia: CMR First-Pass Perfusion Study. BMC Cardiovasc Disord. 2023 May 11;23(1):246.
- Garg P, Grafton-Clarke C, Matthews G, Swoboda P, Zhong L, Aung N, et al. Sex-specific cardiac magnetic resonance pulmonary capillary wedge pressure. Eur Heart J Open. 2024 May;4(3):oeae038.
- Thomson RJ, Grafton-Clarke C, Matthews G, Swoboda PP, Swift AJ, Frangi A, et al. Risk factors for raised left ventricular filling pressure by cardiovascular magnetic resonance: Prognostic insights. ESC Heart Fail. 2024 Aug 12;
Mitral Regurgitation Volume Calculator
Mitral Regurgitation Fraction (%): 0%
- Use of Cardiac Magnetic Resonance Imaging in Assessing Mitral Regurgitation: Current Evidence. Uretsky S, Argulian E, Narula J, Wolff SD. Journal of the American College of Cardiology. 2018;71(5):547-563. doi:10.1016/j.jacc.2017.12.009.
- Assessment of Mitral Valve Regurgitation by Cardiovascular Magnetic Resonance Imaging. Garg P, Swift AJ, Zhong L, et al. Nature Reviews. Cardiology. 2020;17(5):298-312. doi:10.1038/s41569-019-0305-z.
- 2020 ACC/AHA Guideline for the Management of Patients With Valvular Heart Disease: A Report of the American College of Cardiology/American Heart Association Joint Committee on Clinical Practice Guidelines. Otto CM, Nishimura RA, Bonow RO, et al. Journal of the American College of Cardiology. 2021;77(4):e25-e197. doi:10.1016/j.jacc.2020.11.018.
- Usefulness of Mitral Regurgitant Volume Quantified Using Magnetic Resonance Imaging to Predict Left Ventricular Remodeling After Mitral Valve “Correction”. Uretsky S, Shah DJ, Lasam G, et al. The American Journal of Cardiology. 2020;125(11):1666-1672. doi:10.1016/j.amjcard.2020.02.045.
- Discordance Between Echocardiography and MRI in the Assessment of Mitral Regurgitation Severity: A Prospective Multicenter Trial. Uretsky S, Gillam L, Lang R, et al. Journal of the American College of Cardiology. 2015;65(11):1078-88. doi:10.1016/j.jacc.2014.12.047.
- Mitral Annular Disease at Cardiac MRI: What to Know and Look For. Silva Ferreira MV, Soares CSP, Araujo-Filho JAB, et al. Radiographics : A Review Publication of the Radiological Society of North America, Inc. 2024;44(7):e230156. doi:10.1148/rg.230156.
Aortic Regurgitation Calculator
Aortic Regurgitation Fraction (ARF) (%): 0%
Cardiac magnetic resonance imaging (CMR) offers several benefits over echocardiography in the assessment of aortic regurgitation (AR), particularly in its ability to provide accurate and reproducible quantification of regurgitant volume and regurgitant fraction.
Firstly, CMR provides absolute regurgitant volumes and fractions irrespective of the number, eccentricity, or type of regurgitant jets, which can be challenging to assess accurately with echocardiography. This is particularly advantageous in cases of prosthetic valve regurgitation, where echocardiography may underestimate the severity of regurgitation due to technical limitations.[1]
Secondly, CMR allows for direct measurement of both antegrade and retrograde flow using phase-contrast imaging, which is not affected by the variability in the shape of the regurgitant orifice during the cardiac cycle, a common limitation in echocardiography. This results in more consistent and reproducible measurements.[2]
Additionally, CMR provides comprehensive assessment of left ventricular (LV) volume, LV systolic function, and aortic morphology, which are crucial for determining the timing of surgical intervention in AR patients.
Studies have demonstrated that CMR-derived parameters, such as regurgitant fraction and LV end-diastolic volume, are strong predictors of clinical outcomes, including the need for surgery and the development of heart failure symptoms.[3] This predictive capability underscores the clinical utility of CMR in managing AR.
Recent studies have shown that CMR-derived LV end-systolic volume index (LVESVi) and indexed LV end-diastolic volume (LVEDVi) are strong predictors of clinical outcomes in AR patients. Specifically, an LVESVi ≥ 43 mL/m² and an LVEDVi ≥ 109 mL/m² are associated with worse outcomes, providing additional discrimination over traditional diameter measurements.[4]
References
- Guidelines for the Evaluation of Prosthetic Valve Function With Cardiovascular Imaging: A Report From the American Society of Echocardiography Developed in Collaboration With the Society for Cardiovascular Magnetic Resonance and the Society of Cardiovascular Computed Tomography. Zoghbi WA, Jone PN, Chamsi-Pasha MA, et al. Journal of the American Society of Echocardiography : Official Publication of the American Society of Echocardiography. 2024;37(1):2-63. doi:10.1016/j.echo.2023.10.004.
- Guidelines for the Evaluation of Valvular Regurgitation After Percutaneous Valve Repair or Replacement: A Report From the American Society of Echocardiography Developed in Collaboration With the Society for Cardiovascular Angiography and Interventions, Japanese Society of Echocardiography, and Society for Cardiovascular Magnetic Resonance. Zoghbi WA, Asch FM, Bruce C, et al. Journal of the American Society of Echocardiography : Official Publication of the American Society of Echocardiography. 2019;32(4):431-475. doi:10.1016/j.echo.2019.01.003.
- A Comparison of the Clinical Efficacy of Echocardiography and Magnetic Resonance for Chronic Aortic Regurgitation. Postigo A, Pérez-David E, Revilla A, et al. European Heart Journal. Cardiovascular Imaging. 2022;23(3):392-401. doi:10.1093/ehjci/jeaa338.
- Influence of Cardiac Remodeling on Clinical Outcomes in Patients With Aortic Regurgitation. Malahfji M, Crudo V, Kaolawanich Y, et al. Journal of the American College of Cardiology. 2023;81(19):1885-1898. doi:10.1016/j.jacc.2023.03.001.
CMR-Derived Mean Right Atrial Pressure
CMR Derived Mean Right Atrial Pressure Calculator
Right atrial pressure (RAP) is a key haemodynamic parameter reflecting right ventricular filling pressure and overall cardiac preload. Elevated RAP is an established marker of adverse prognosis: in pulmonary arterial hypertension, it is an independent predictor of mortality, and in heart failure with preserved ejection fraction (HFpEF), it represents the cumulative burden of left heart, pulmonary vascular and right heart abnormalities, predicting cardiac death and heart failure hospitalisation.[1,2,3]
Until recently, no validated CMR model existed to estimate RAP. Newman and colleagues addressed this gap by developing a regression model in a derivation cohort of 672 patients with paired same-day right heart catheterisation and CMR, and testing it prospectively in an independent clinical cohort.[4] Right atrial end-systolic volume (RAESV) measured from the four-chamber cine showed the strongest correlation with invasive mean RAP (Pearson r = 0.58). The parsimonious model — using RAESV alone — performed as well as more complex models incorporating right atrial strain, right ventricular volumes, or patient characteristics. The validated equation is:
CMR mRAP (mmHg) = 6.4547 + (RAESV × 0.05828)
In the independent clinical cohort, a CMR-derived mRAP ≥ 10 mmHg was associated with peripheral oedema (AUC 0.75). The model is most discriminatory at elevated RAP; performance at normal or low RAP requires further validation in healthy and hypovolaemic populations.
Used alongside the CMR-PCWP calculator, CMR-derived mRAP supports non-invasive haemodynamic assessment of both right and left ventricular filling pressures from a single CMR study, which is particularly relevant in HFpEF and pulmonary hypertension associated with left heart disease.[4]
References
- Alenezi F, Mandawat A, Il’Giovine ZJ, et al. Clinical utility and prognostic value of right atrial function in pulmonary hypertension. Circ Cardiovasc Imaging. 2018;11:e006984. doi:10.1161/CIRCIMAGING.117.006984.
- Nagata R, Harada T, Omote K, et al. Right atrial pressure represents cumulative cardiac burden in heart failure with preserved ejection fraction. ESC Heart Fail. 2022;9:1454–62. doi:10.1002/ehf2.13853.
- Austin C, Alassas K, Burger C, et al. Echocardiographic assessment of estimated right atrial pressure and size predicts mortality in pulmonary arterial hypertension. Chest. 2015;147:198–208. doi:10.1378/chest.13-3035.
- Newman TAH, Matthews G, Assadi H, et al. Cardiac MRI-derived mean right atrial pressure and its prognostic importance. Open Heart. 2025;12:e003216. doi:10.1136/openhrt-2025-003216.
CMR-Derived Mixed Venous Oxygen Saturation
CMR-Derived Mixed Venous Oxygen Saturation (iSvO2) Calculator
Mixed venous oxygen saturation (SvO2), traditionally measured invasively in the pulmonary artery during right heart catheterisation, is an established marker of tissue oxygen extraction and a powerful prognostic indicator in heart failure. A reduced SvO2 reflects the increased oxygen extraction that occurs as global oxygen delivery falls in low cardiac output states; in acute decompensated heart failure, an SvO2 < 60% is associated with adverse outcomes.[1,2]
McDiarmid and colleagues developed a CMR-derived equivalent — termed iSvO2 (imaging-derived SvO2) — based on the principle that the T2 relaxation time of blood depends on its oxygenation, with deoxygenated haemoglobin shortening T2 and oxygenated haemoglobin lengthening it.[3] In a discovery cohort of 30 patients undergoing same-day CMR and right heart catheterisation, the ratio of right to left ventricular blood pool T2 relaxation times correlated strongly with invasively measured SvO2 (R = 0.82, P < 0.001). The validated equation is:
iSvO2 = 95 × (RV-T2BP / LV-T2BP)
where RV-T2BP and LV-T2BP are the T2 relaxation times of the right and left ventricular blood pools, measured in milliseconds from the basal short-axis T2 map. By normalising the deoxygenated RV blood pool to the oxygenated LV blood pool (the internal arterial reference), the ratio cancels patient-specific factors such as haematocrit and field strength, allowing the same equation to be applied at 1.5 T or 3 T.
Measurement protocol — how to record LV and RV blood pool T2
The following protocol replicates the method validated by McDiarmid et al.[3]
- Acquire a T2 map at the basal short-axis slice. Use a T2-prepared spoiled gradient echo (FLASH) sequence with T2 preparation pulse durations of 0, 35 and 55 ms. The basal short-axis slice is specified deliberately because the right ventricle shows less trabeculation at this level than at mid- or apical slices, reducing partial-volume contamination of the RV blood pool ROI.
- Open the T2 map in dedicated post-processing software. McDiarmid et al used cvi42 (Circle Cardiovascular Imaging); any T2 mapping–capable platform that can return the mean T2 of a manually drawn region of interest is suitable.
- Segment the LV blood pool (LV-T2BP). Draw a manual region of interest within the LV cavity. Carefully trace the endocardial border to separate the blood pool from the LV myocardium. Exclude trabeculations, papillary muscles, and any voxels at the endocardial edge that are likely to be partial-volume affected. Record the mean T2 (in ms) within the ROI — this is LV-T2BP.
- Segment the RV blood pool (RV-T2BP). On the same basal short-axis slice, draw a separate manual ROI within the RV cavity. Take particular care to exclude the moderator band and RV trabeculations. Record the mean T2 (in ms) within the ROI — this is RV-T2BP.
- Enter both values into the calculator above. iSvO2 is computed from the ratio. Because the equation is ratio-based, it is field-strength independent: the same formula applies to T2 maps acquired at 1.5 T and at 3 T.
- Quality considerations. T2 mapping in clinical use typically employs single-shot imaging with motion correction, which gives acceptable results even in atrial fibrillation (around one-third of the validation cohort were in AF). The acquisition is short (5–10 seconds per slice) and does not require contrast.[3]
In an independent validation cohort of 628 patients with newly diagnosed heart failure (LVEF < 50%), lower iSvO2 was associated with the composite endpoint of death or heart failure hospitalisation over a median 3-year follow-up (HR 0.66 per 10% increase in iSvO2; 95% CI 0.54–0.81; P < 0.001). The association remained significant after adjustment for age, sex, LVEF, RVEF, NT-proBNP, NYHA functional class and diabetes.[3] Kaplan-Meier strata in the paper were > 60%, 50–60% and < 50%, with progressively worse outcomes at lower iSvO2.
iSvO2 has important limitations: the equation assumes arterial oxygen saturation is constant, so it is unlikely to be accurate in patients with reduced arterial saturation (e.g. advanced pulmonary disease), and may be inaccurate in severe anaemia given the influence of haematocrit on blood T2. The model was developed using Siemens 1.5 T and 3 T scanners with standard T2-prepared spoiled gradient echo (FLASH) sequences; further work is needed to determine whether the same equation transfers across vendors and alternative T2 mapping techniques (e.g. MESE, GraSE).[3]
References
- Gallet R, Lellouche N, Mitchell-Heggs L, et al. Prognosis value of central venous oxygen saturation in acute decompensated heart failure. Arch Cardiovasc Dis. 2012;105:5–12. doi:10.1016/j.acvd.2011.10.006.
- Lim HS. Cardiogenic shock: failure of oxygen delivery and oxygen utilization. Clin Cardiol. 2016;39:477–483. doi:10.1002/clc.22564.
- McDiarmid AK, Chambers BS, Broadbent DA, et al. Development and validation of a noninvasive model of mixed venous oxygen saturation in heart failure. JACC Adv. 2026;5:102484. doi:10.1016/j.jacadv.2025.102484.
Author
Dr Pankaj Garg MD MRCP FRCP FESC
Disclaimer:
- These calculators are for educational and informative purposes ONLY.
- The calculators provided are not meant to be a substitute for professional advice.
- The information provided is not to be used for medical diagnosis.
- The authors make no claims of the accuracy of the information contained herein.
- The authors make no claims whatsoever, expressed or implied, about the authenticity, accuracy, reliability, completeness, or timeliness of the material, software, text, graphics, and links given.
- In no event shall the authors, its suppliers, affiliates, or any third parties be liable in any manner whatsoever for any damage arising upon use of any information provided.
Link to Android version: Download Here.
